
Performance, Drivability & Efficiency. Simplified!
|
MegaLogViewer MS
MegaLogViewer MegaSquirt Edition
|

|
Quick Links:
VE Table Tuning Instructions
Change Log
Download JRE
FAQ
Download
Upgrade Registration
Tuning with MegaLogViewer VE Analysis
Requirements:
- MegaLogViewer
- TunerStudio - Used to capture the data log files and provide msq
How to use:
- Drive car through as many throttle positions and RPM ranges ans possible.
There is no need to disable Gego correction, Accel enrich or over run drive under the same configuration
as you would any other time you are driving the car.
- Collect 15 minutes of data or more logging with TunerStudio MS
- Save current Megasquirt configuration (MSQ) with TunerStudio MS
- Open Log file in MegaLogViewer
- Open MSQ that you were running on while logging
- O2 selection
- MS1 & MS1-extra - if using an Wideband O2 sensor, select it from the Wideband O2 AFR menu.
- MSII - No need to select an O2 sensor, AFR will be read directly from the log file for WB
- NB All - O2 field will be used
- Set the top table to the VeTable you wish to analyze
- Click VE Analyze
- In the dialog, click Run Analysis
- When analysis is complete, the suggested table will be displayed.
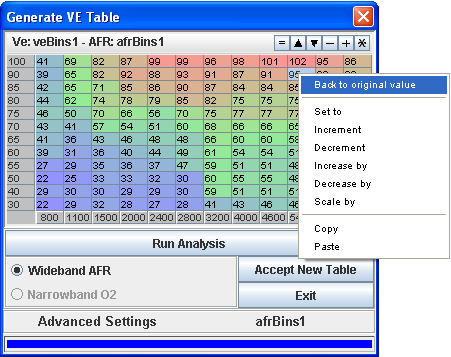
You can view the original value in the tooltip along with the hit count and weighting.
The higher the weighting the more sure you can be that optimal value has been generated.
However, if weighting is low, the value should not vary far from original as the original value carries it's own weighting.
If weighting is low, try generating another log file with more driving at the cell you are viewing. Not all cells can actually be used though, these cells you are probably not to concerned with.
- Using a Mouse right click you can revert any selected cells back to the original value or modify them before accepting the new table.
Advanced Controls
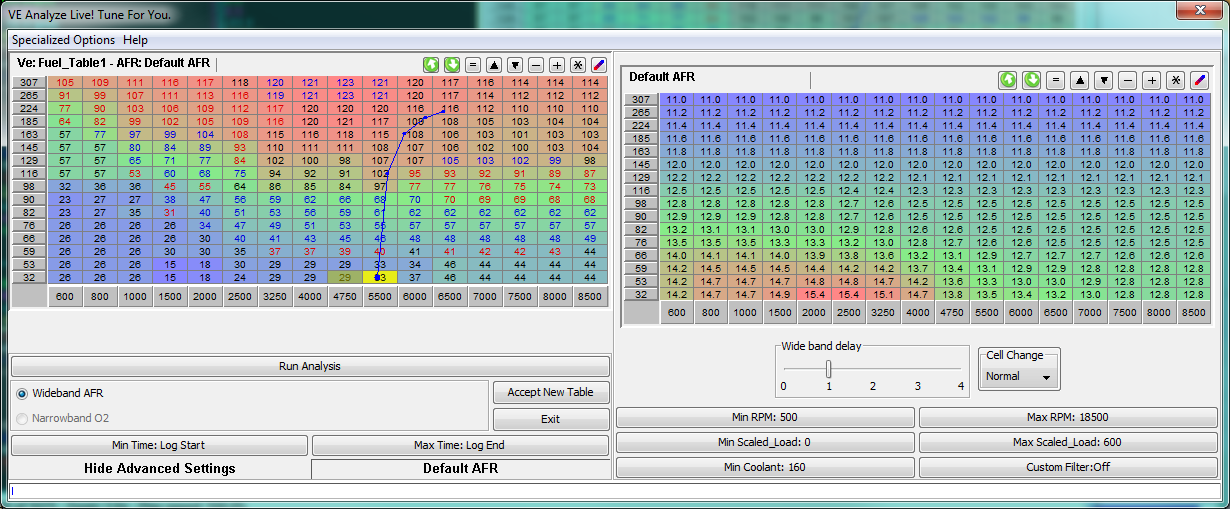
- Cell Change - This impacts the amount of data required to move
the cell value or could be looked at as the cell
resistance to change. If set to Hard, the initial cell value
is more respected and will require stronger analysis data
to change.
- Wide band delay - Adjust Wide band O2 sensor delay,
compensates for delay in WB O2 sensor readings If set to 1 the AFR value
from x+1 will be used when processing record x. Example: Wide band delay set to 1,
when record 241 is processed the AFR value from record 242 will be used. If set to 2,
AFR from record 243 will be used. Normally,
Best results are achieved set from 0-2,
depending on car setup, O2 sensor, records/sec in your log file and RPM you are focusing
tune. Higher RPM's tend to need less delay.
- Min RPM - Data Filter, filters all records below the displayed value. To edit, click and enter the new value.
This is used to filter out log records where the engine is not running.
You can also use this to filter idling log values in a situation where
idle AFR is not accurate due to leaky exhaust, big cam or excessive spark advance.
- Max RPM - Data Filter, filters all records above the displayed value. To edit, click and enter the new value.
By default this is set to high to have impact, but this can be used to filter
rev-limiter hits that have impacted AFR.
- Min MAP - Data Filter, filters all records below the displayed value. To edit, click and enter the new value.
This filter helps to focus on only specific region or area of your VE table.
- Max MAP - Data Filter, filters all records above the displayed value. To edit, click and enter the new value.
This filter helps to focus on only specific region or area of your VE table.
- Start Time - Data Filter, filters all records before the displayed value. To edit, click and enter the new value.
This filter allows you to use only a section of your log file for VE Analysis.
- Stop Time - Data Filter, filters all records after the displayed value. To edit, click and enter the new value.
This filter allows you to use only a section of your log file for VE Analysis.
- Min CLT - Starting with vesion 2.69, records are no longer filtered based on the warmup flag. Instead Min CLT was added
as a configurable setting. This is the minimum value for CLT that will be used as input during
VE Analysis.
- Custom Filter - The Customer filter allows for any specialized filter you may require. Usage is a little more advanced,
but with this single filter you can do what all the others do plus a great deal more. You can enter any logical expression with
field references, the logical expression is executed for every record to determine if it should be used as valid input.
Example: [RPM] > 2000 && [TP] > 80
All records with an RPM over 2000 and TP value over 80 will be filtered from VE Analysis and not used for calculating the resulting
table. More information on usage of the Math Parser can be found here.
©2006-2020 EFI Analytics
|